Exoplanet Data


Fichiers imprimables (1)
-
 stl
stlTarabulsiS_A8_STL.stl
344 Ko · 191 téléchargements
Description
Susan Tarabulsi
11/22/2020
George Mason University Math 401: Mathematics Through 3D Printing
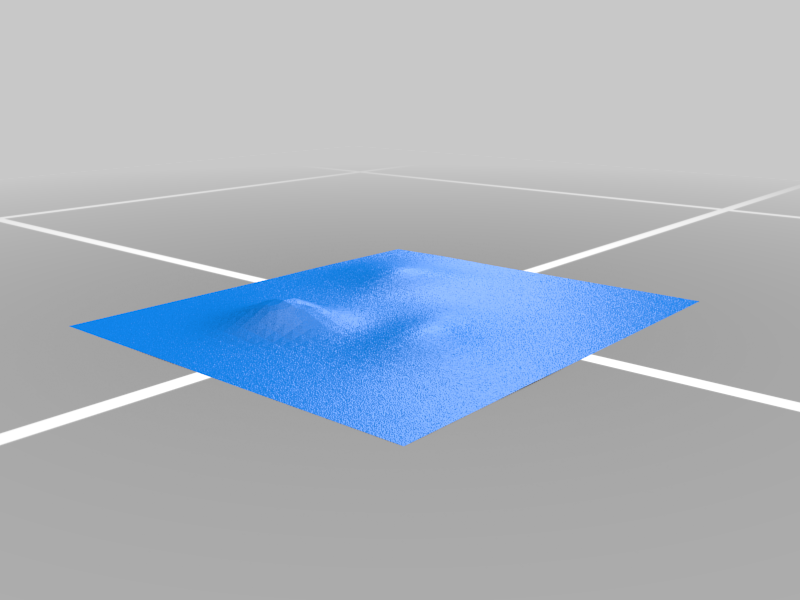
This is a three-dimensional smooth histogram that visualizes the frequency of the orbit period and mass of exoplanets. The orbit period is measured in days and the mass is measured in kilograms with logarithmic scaling.
Mathematica was used to create this histogram. The image attached shows the code used to produce this visualization. The exoplanet data is stored in Mathematica with a list of properties containing orbit period and mass. The data set is incomplete. Therefore, this visualization consists of data from 4283 exoplanets.
This histogram will be printed using the Makerbot printer, and will take approximately one hour to print. Support is required to successfully print.